Eneco has a great ambition: to be climate neutral by 2035. Its ‘One Planet Plan’, which was further refined in 2021, includes concrete actions and measurable objectives, such as converting or closing down gas-fired power plants and investing in new heat sources. With its various actions and investments, Eneco hopes to make an active contribution to the goal of keeping global warming below 1.5 degrees centigrade.
Data analytics dashboard
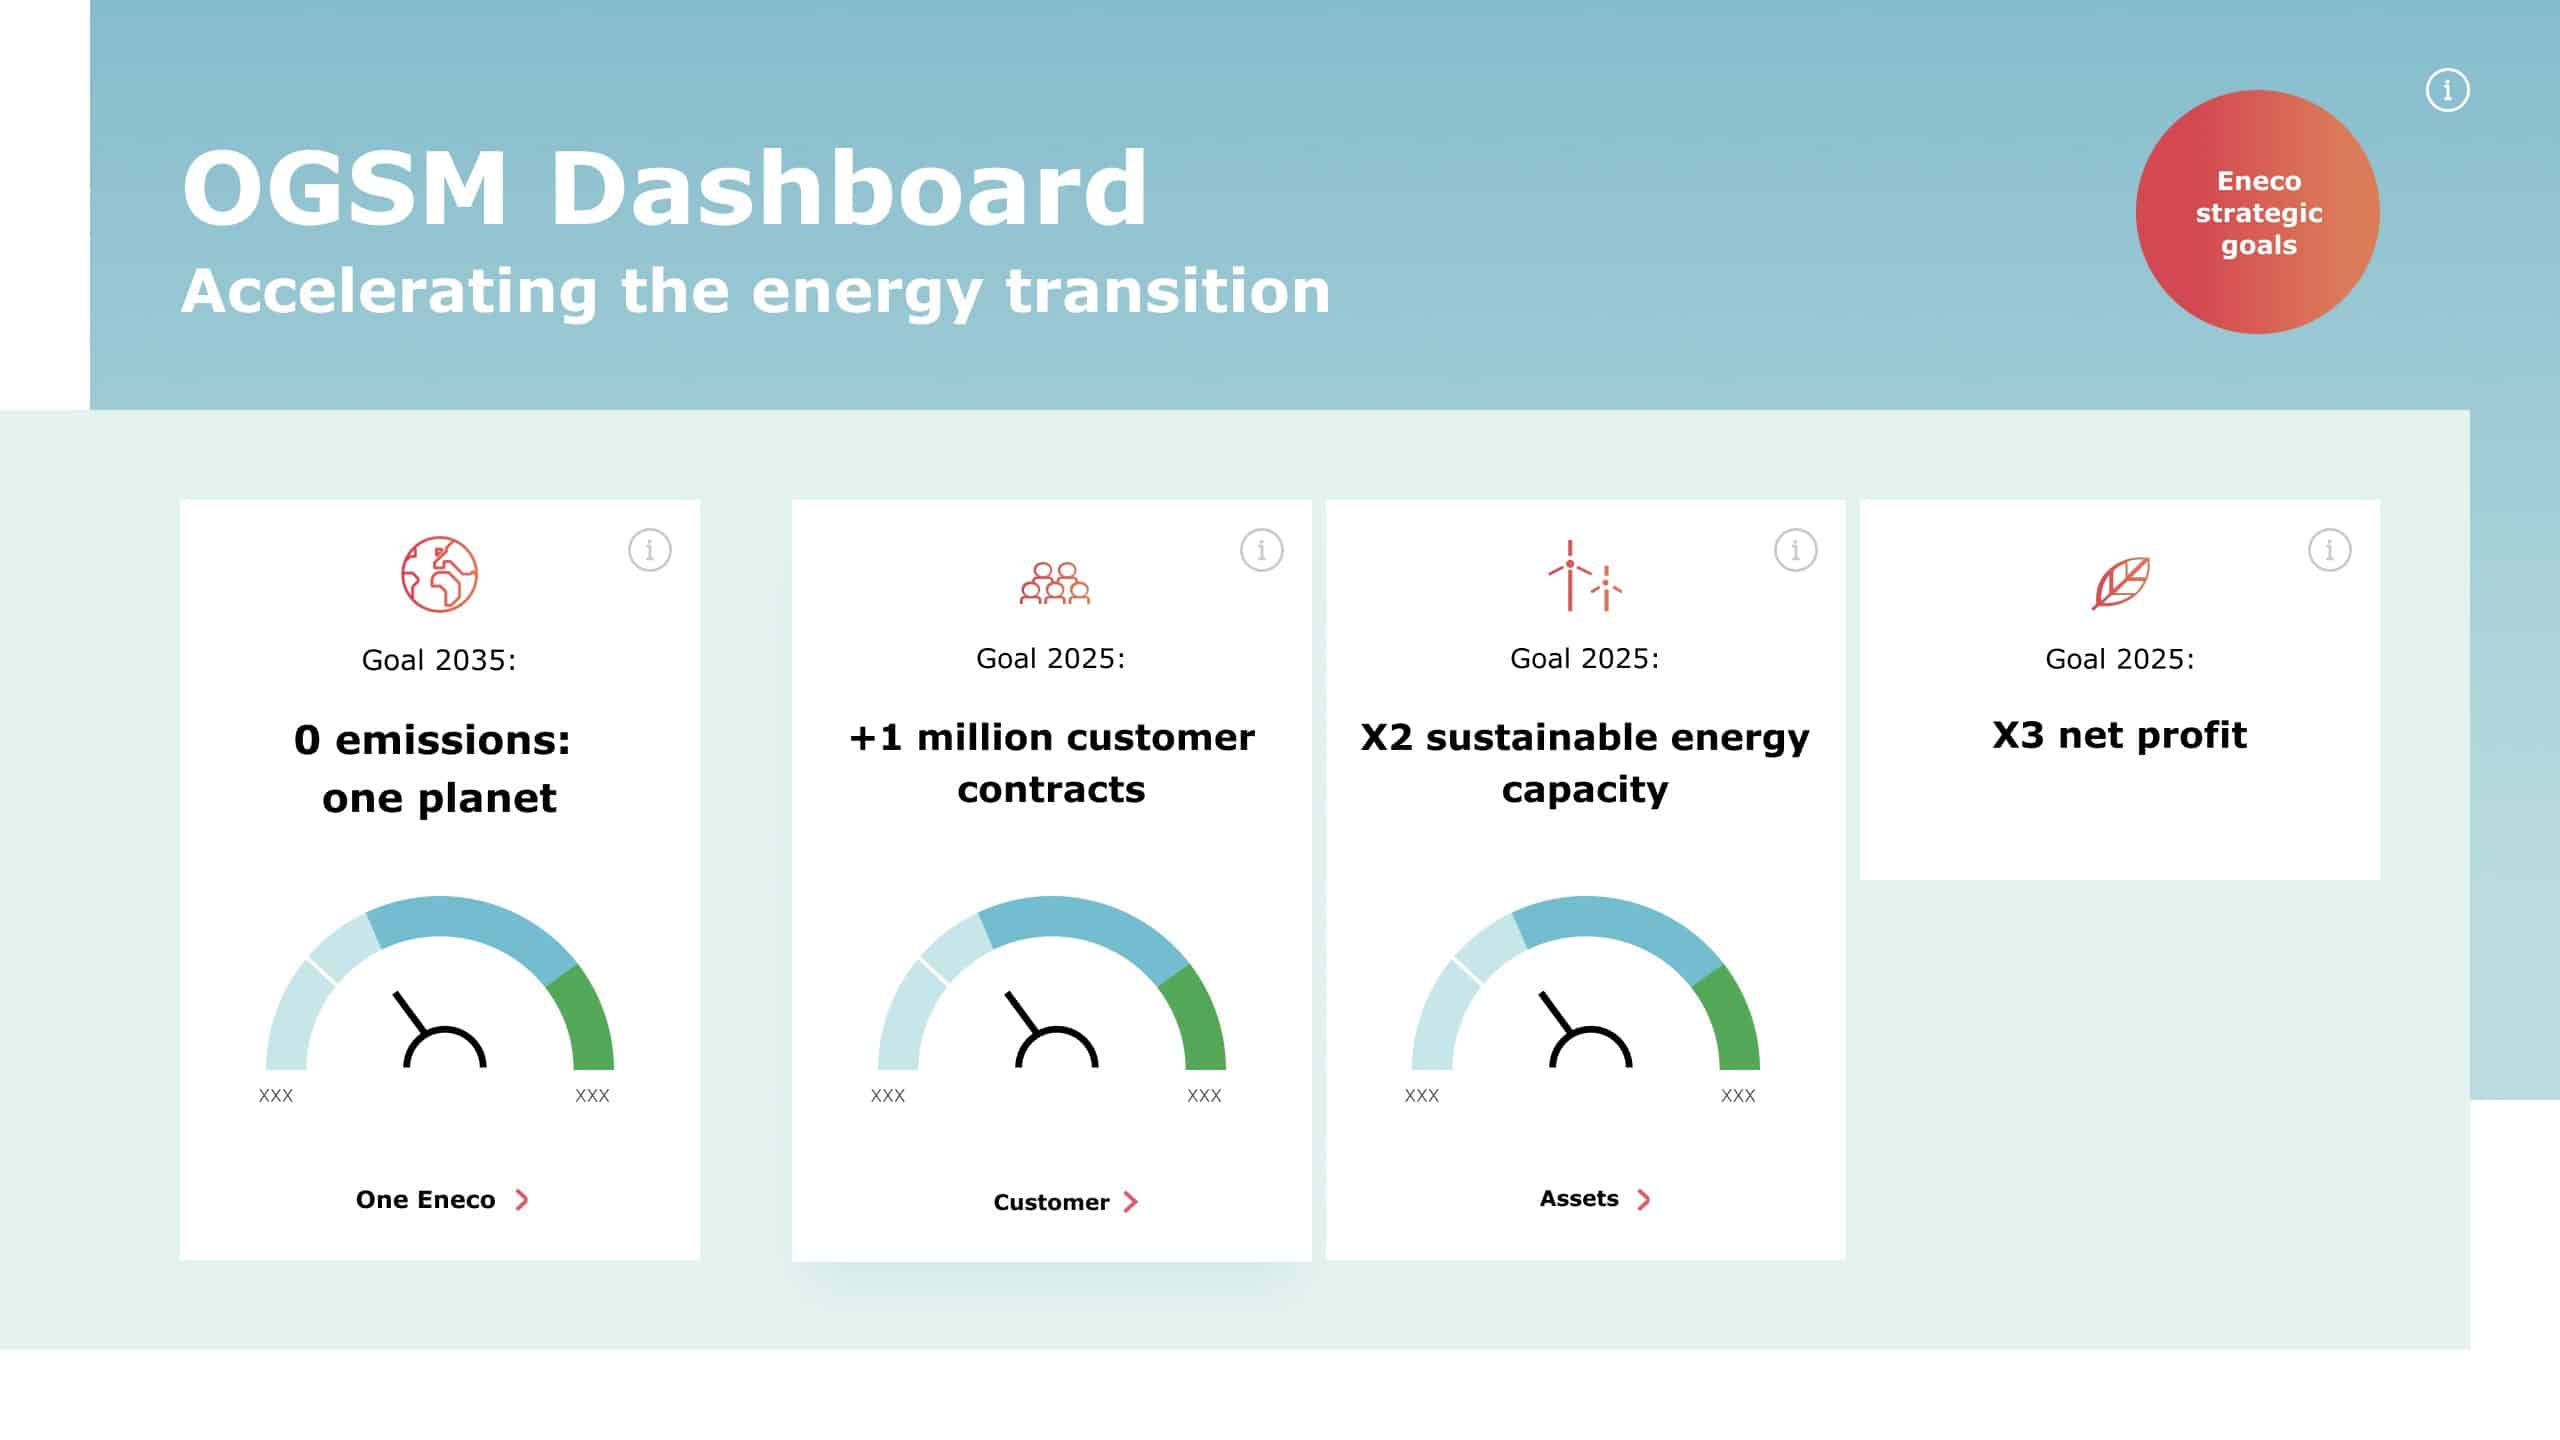
A joint effort is being made by customers and employees to implement the climate plan. In order to make the strategy and plan more visible to all employees and get them involved, the energy company decided to have a data analytics dashboard designed and developed. The dashboard would allow every employee to check the current status at any time and see whether things are on track for achieving the big goal.
‘Macaw has made a crucial contribution to the creation of the Eneco KPI dashboard, which means that every Eneco employee can now monitor progress on the strategy in a transparent manner.’ – Klaasse, Head of Asset Control & Steering Eneco.
Consultant, designer and developer
The energy company enlisted Macaw to help with developing the dashboard. Macaw has been a partner to Eneco for more than seven years now and has completed various successful projects, such as the implementation of an intranet, a Power BI Competence Center and various PowerApps. Eneco also brings innovation-related questions to its Microsoft and Sitecore partner.
Macaw played two roles in the dashboard project:
- Facilitating the creative phase. Designers carefully considered the User Interface (UI) and User Experience (UX) design best suited to a large and diverse target group such as the entire Eneco workforce. They helped ensure that the dashboard would be clear and accessible and have good visitor stats.
- Technical development of the dashboard using Power BI.
Design as a silver bullet
‘We’re very happy with how the collaboration with Macaw is going,’ says Ferry Bouwman, Asset Innovation and Transformation project leader at Eneco. ‘Starting off with design sessions was a great move. It was the first time we had gone about building a dashboard in this way. It was brilliant. And successful. Macaw thought in detail about how information needs to be presented in order to activate and involve 3,000 users. It really has been built from the user’s perspective,’ explains Bouwman.
Connecting the dots
‘We like to help our customers be successful,’ says Wouter Stuivenberg, client manager at Macaw. ‘In this case, we did so by combining our skills as a digital agency in UX, UI and Design Thinking expertise with hardcore IT competencies. This ensures, among other things, that we create real value for the business and for end users through the use of technology. It’s great to see how Eneco employees want to work together to achieve a better and more sustainable world, and how we as a partner are able to contribute to this,’ continues Stuivenberg.
KPIs for the entire organization
To stimulate use and increase value, the dashboard can be called up instantly, and is easily accessible via the intranet, Power BI and large screens in the office. Everyone can immediately see how the organization is doing. To increase engagement, the 15 clearly specified KPIs are available to the entire organization. This allows employees to ‘take a peek at their neighbors’ – in short, they can see how other organizational units are doing, for example in terms of customer contracts and assets, but also in areas such as diversity and safety.
The future
In the future, Eneco wants to further expand the dashboard with additional KPIs, work in an even more data-driven manner, and increase value creation from data. New dashboards will also follow.